Key figures Forbo Group
Below you find some financial key figures for the Forbo Group.
We see it as our responsibility to safeguard the interests of our shareholders by being transparent and issuing regular reports on the activities of our business.
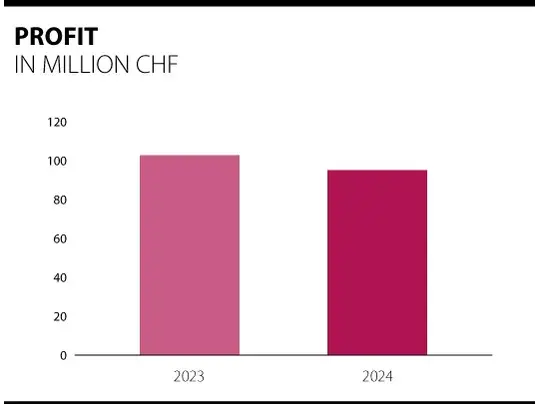
The lower operating profit also decreased the Group’s profit by 7.0% or CHF 7.2 million to CHF 95.1 million (previous year: CHF 102.3 million), despite a slightly lower tax rate of 21.8% (previous year: 22.4%) and a positive financial result of CHF + 1.0 million (previous year: CHF + 1.9 million).


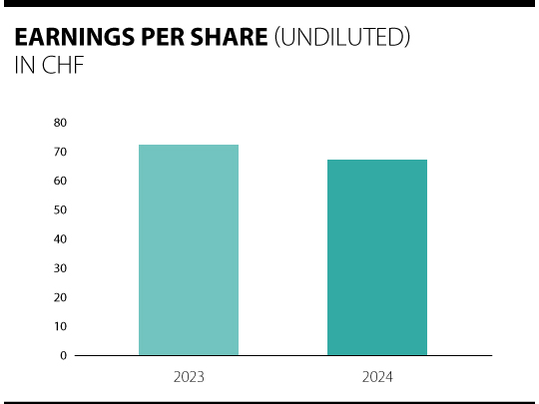
The undiluted earnings per share for the financial year 2024 reflect the change in earnings, decreasing by 7.0% to CHF 67.45 (previous year: CHF 72.55).
Earnings per share are calculated by dividing the net profit or loss for the year attributable to registered shareholders by the weighted average number of registered shares issued and outstanding during the year, less the average number of treasury shares.
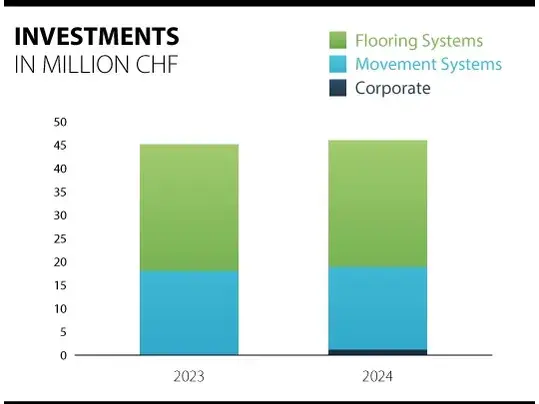
In 2024, funds were invested particularly in developing the product portfolio, technology, sustainability, and expanding capacities. The Group’s total investments in property, plant, and equipment and intangible assets came to CHF 46.1 million (previous year: CHF 45.3 million), a slight increase of 1.8%. In total, 57% of the investments were for replacements and 43% for rationalizations and expansions.
Flooring Systems invested CHF 27.1 million (previous year: CHF 26.8 million). As in the previous year, a significant part of this went towards expanding the Flotex flooring plant in the U.S. Investments at the vinyl plant in Coevorden, the Netherlands, were for the homogenous vinyl line to improve product quality in packaging, dimensional stability, and to increase production efficiency. Further significant investments in vinyl were made at the plant in Reims, France, which when modified can integrate a higher proportion of recycled material into our products and will thus reduce our carbon footprint considerably. Other smaller investments in various production facilities were made to renew equipment and improve production capacity and quality.
Investments in Movement Systems’ property, plant, and equipment came to CHF 18.1 million (previous year: CHF 17.8 million). Most of these funds went to modernizing the production site in Fukuroi in Japan. Investments to reduce energy consumption, for example, also went into ventilation systems, further modernizing production facilities, new service centers, and installing additional photovoltaic systems in Europe.

| 2024 | 2023 | 2022 | 2021 | 2020 | |
| CHF million | |||||
| NET SALES | 1,122.0 | 1,175.2 | 1,293.2 | 1,254.0 | 1,117.7 |
| Cost of goods sold | -737.1 | -773.5 | -852.4 | -803.0 | -707.5 |
| GROSS PROFIT | 384.9 | 401.7 | 440.8 | 451.0 | 410.2 |
| Development costs | -15.3 | -15.7 | -15.6 | -15.9 | -15.2 |
| Marketing and distribution costs | -160.3 | -168.5 | -178.6 | -175.3 | -171.3 |
| Administrative costs | -86.8 | -80.1 | -94.2 | -92.8 | -86.4 |
| Other operating expenses | -8.8 | -17.2 | -27.7 | -7.2 | -15.2 |
| Other operationg income | 6.9 | 9.7 | 7.9 | 19.2 | 14.9 |
| OPERATING PROFIT | 120.6 | 129.9 | 132.6 | 179.0 | 137.0 |
| Financial income | 2.7 | 5.7 | 0.9 | 3.0 | 0.7 |
| Financial expenses | -1.7 | -3.8 | -2.5 | -0.8 | -1.6 |
| PROFIT BEFORE TAXES | 121.6 | 131.8 | 131.0 | 181.2 | 136.1 |
| Income taxes | -26.5 | -29.5 | -29.6 | -40.0 | -29.9 |
| PROFIT FOR THE YEAR | 95.1 | 102.3 | 101.4 | 141.2 | 106.2 |